Bode and Nyquist Plots
The system or transfer function determines the frequency response of a system, which can be visualized using Bode Plots and Nyquist Plots. The pole/zero diagram determines the gross structure of the transfer function.
 The system or transfer function determines the frequency response of a system, which can be visualized using Bode Plots and Nyquist Plots. The pole/zero diagram determines the gross structure of the transfer function.
9 Responses to “Bode and Nyquist Plots”

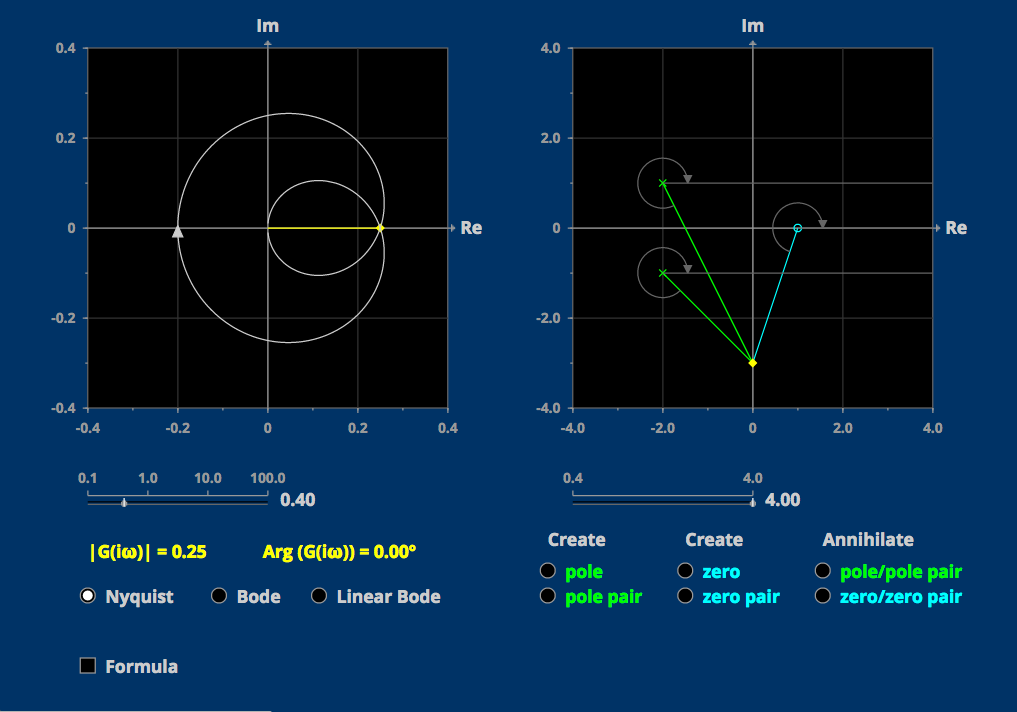
BODE AND NYQUIST PLOTS
These interactive tools are so good that learning and understanding things have become so easy. Thank you so much for developing such a tool and make it available for free for everyone. This kind of things really helps students like me.
My query is that by any chance is it possible to use this tool offline (without connecting to the internet) or is there any offline version of these tools or any android apps. Can you kindly provide me with the information regarding this????
I'm glad you find them useful, Ganesh. There is a plan to allow a download of a zip file of the entire collection. Stay tuned.
The tool is awsome!! Very useful and FREE!! The only thing is that you can't write your own formula to calculate the diagrams; you have to try to set poles and zeros the more precisely you can to obtain the formula. Thanks anyway!
Glad you like it, Gmark!
The Mathlets are designed as teaching and learning tools, not for calculation. The ability to move the zeros and poles on the screen and observe the effects on the plots trumped any thought of inputting coordinates. But did you notice the zoom feature? You can achieve greater accuracy using it.
I just love this tool!
Got a suggestion: Can you also add the system gain parameter? So that one can see the variation in the plots with k.
Thanks!
If I understand what you mean by "system gain parameter," won't this just scale the plots? So in the Nyquist plot, the visual effect is the what you get by zooming. The gain is often defined up to a pretty arbitrary factor anyway (depending on what units you choose for example).....
Could we add root locus & time domain plot here? It would be very helpful if we could plot between state space domain, time domain & root locus plot all together.
There is a real estate problem: you can't show everything. Other Mathlets do connect the time domain with the Bode plot and with the root locus. I'm glad that this tool is being used, in any case!
I think that Glen refers to have the possibility to add a constant factor either at the numerator or the denominator of the formula, because if you see the static gain (the gain when w=0) is always less than 1, and so, the red unit circle presented that helss you to determine encirclements of the point (-1,0), in order to use Nyquist's stability criterion, is not useful at all. Any way it's a very useful tool